> ## Documentation Index
> Fetch the complete documentation index at: https://docs.ekyam.ai/llms.txt
> Use this file to discover all available pages before exploring further.
# Monitoring Dashboard
### **• Monitor & Troubleshoot Connectors**
The Monitoring Dashboard provides real-time insights into data-flow, allowing you to quickly identify and address issues.
 ### **• Key Metrics and Interpretation**
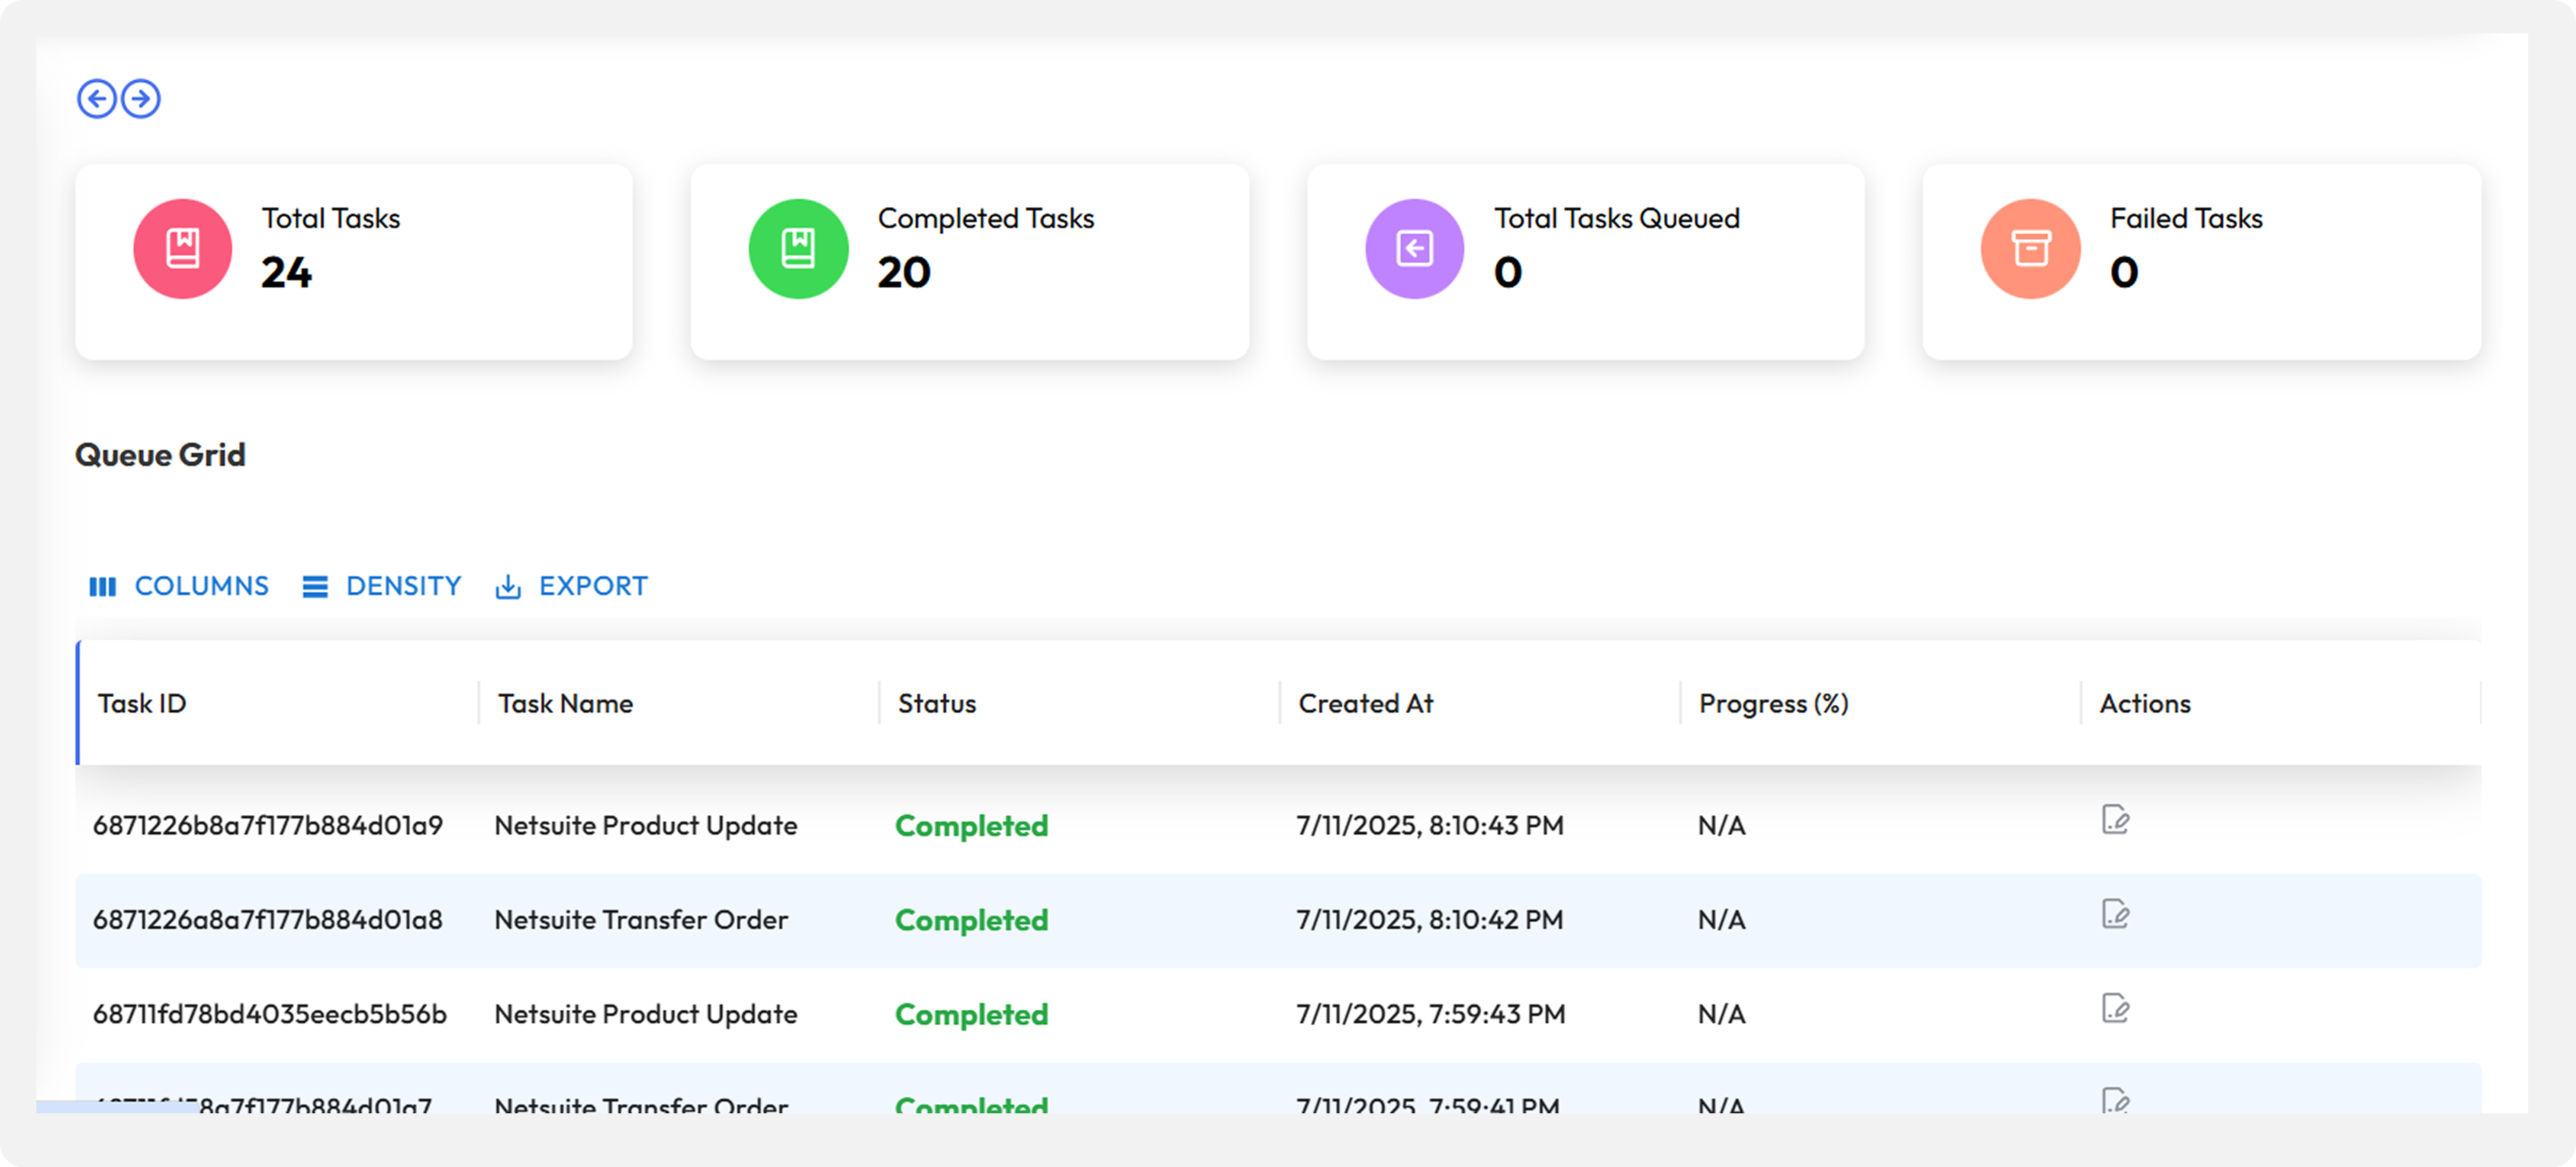
The dashboard presents various key metrics that are essential for understanding performance of Ekyam’s data connectors.
**Successful Transactions:** The successful transaction metric indicates the number of records or data that have successfully completed their journey through the connectors and workflows.
**Pending Tasks (Queue Tracker):** The Ekyam’s Queue Tracker shows the number of data items currently awaiting processing in various queues.
**Errors/Failed Transactions:** This critical metric highlights the number of transactions that encountered an error during processing.
### **• Key Metrics and Interpretation**
The dashboard presents various key metrics that are essential for understanding performance of Ekyam’s data connectors.
**Successful Transactions:** The successful transaction metric indicates the number of records or data that have successfully completed their journey through the connectors and workflows.
**Pending Tasks (Queue Tracker):** The Ekyam’s Queue Tracker shows the number of data items currently awaiting processing in various queues.
**Errors/Failed Transactions:** This critical metric highlights the number of transactions that encountered an error during processing.
.jpeg?fit=max&auto=format&n=LbTHkXvQFBvvlMXb&q=85&s=e68d7b1cc3294176527eb9dfb07b50db)